The Secret Behind AI Product Research: 7 Signals That Predict Best-Selling Items

You can grow your business a lot with AI Product Research. Did you know that almost 80% of online stores use AI? Some stores see their money go up by 40% with personalized recommendations. Look at how AI changes online shopping today:
Statistic Description | Value |
|---|---|
Percentage of online retailers using AI | 80% |
Revenue boost from AI personalization | Up to 40% |
Increase in sales from retail chatbots | 67% |
Think about what you could do if you improve your product research. Are you ready to change how you work?
Key Takeaways
AI Product Research helps your business grow by using real facts. It lets you make smart choices.
AI tools help you work faster. They are more correct than old ways of research.
Sales velocity is important. Watch it to see how fast your products sell.
Look for sales going up. Check if more customers are interested. This helps you find best-sellers.
Watch search volume and competition. This shows if people want your product and where it fits in the market.
Customer sentiment analysis shows how buyers feel. It helps you make your products better.
Social media buzz can help you sell more. Track mentions and likes to find new trends.
A strong value proposition matters. It tells customers why they should pick your product.
AI Product Research Importance
Data-Driven Decisions
You want to choose products that people will buy. AI Product Research uses real data, not guesses, to help you. When you use data, you make fewer mistakes. You can find patterns and trends that you might not see alone. Here are some reasons why using data is better than just guessing:
You use facts, not just what you feel. This helps you avoid mistakes and get steady results.
You can check your choices often. If things change, you can fix your plan fast.
You notice patterns and trends that are hard to guess by yourself.
AI tools like Eliotron, Maze, Tradelle, and ProductXpert help you gather and study this data. They show you what customers want and how the market changes. You get a clear view, so you can make good choices.
Outperforming Traditional Methods
You may wonder if AI Product Research is really better than old ways. Let’s look at both side by side:
Aspect | Traditional Research | AI-Driven Research |
|---|---|---|
Efficiency | Takes a lot of work and time | Automated, makes data collection easy |
Accuracy | People can make mistakes | Very accurate with machine learning |
Scalability | Hard to use with lots of new data | Grows fast and works with new data quickly |
Speed | Slow to process information | Looks at big data sets very fast |
Insights | Deep look at what people do | Finds big trends from lots of data |
Hybrid Approach | Uses personal ideas | Adds numbers for more details |
AI Product Research is faster and finds more details. Tools like Perplexity Deep Research, Gemini Deep Research, and ProductResearch.ai can check thousands of products in minutes. You save time and get better answers.
Actionable Insights
You want tips you can use, not just numbers. AI Product Research gives you clear steps to follow. For example, Appen helps you find the right customers with smart data. YouScan shows what people say about products online. Crayon lets you watch your competitors, so you know what works for them. SurveyMonkey Genius helps you ask better questions and understand answers. Market Insights AI finds new trends and ways to grow.
Other tools like Kore.ai and InMoment AI help you learn how customers feel and what they want next. Zeda.io connects feedback to your product plans. Pollfish lets you ask real people what they think, right from their phones.
Tip: Use AI tools to find good ideas, but always check the results yourself. AI makes your research better, but your own thoughts matter too.
AI Product Research does not take your place. It helps you work smarter and faster. You still make the final choice, using both AI and your own ideas.
Predictive Signals
Sales Velocity
Definition
Sales velocity shows you how fast a product sells and how quickly you turn interest into real sales. When you track sales velocity, you see how much money comes in over a certain time. This signal helps you spot which products move quickly and which ones slow you down.
Sales velocity tells you how fast you generate revenue from sales.
A higher sales velocity means you turn shoppers into buyers more efficiently.
Watching sales velocity over time gives you a clear picture of your business health.
If you see slow sales velocity, you can find weak spots and fix them to boost future product success.
Identification
You can spot sales velocity by looking at sales reports and dashboards. Many AI Product Research tools, like Eliotron and ProductXpert, show you sales velocity in real time. These tools track how many units you sell each day or week. They also compare your numbers to past months, so you see if you are speeding up or slowing down.
Tip: Set up alerts in your AI tools to notify you when sales velocity drops or jumps. This way, you can act fast and stay ahead of problems.
Upward Trend
Definition
An upward trend means more people want your product over time. You see steady growth in sales, website visits, or customer interest. This signal tells you that your product is becoming more popular and could become a best-seller soon.
Identification
You can find upward trends by checking graphs and charts in your research tools. AI tools like Maze and Tradelle use advanced data integration to pull information from many sources. They spot patterns in your sales history that you might miss. These tools update their forecasts as new data comes in, so you always know what’s happening.
AI tools gather and prepare data from different places quickly.
They recognize patterns in old data that people might overlook.
These tools adjust in real time, so you see changes as they happen.
Scenario planning lets you test different situations and see how your product might perform.
Real-world examples show how powerful upward trends can be:
Acme Software used buying signal data to track website visits and product questions. This led to a 30% jump in conversion rates in just six months.
Fashionable Attire watched for non-verbal buying signals in stores. They saw a 15% rise in average order value and a 25% boost in customer satisfaction.
Note: When you spot an upward trend early, you can invest more in marketing or stock up before your competitors do.
Search Volume & Competition

Definition
Search volume tells you how many people look for a product online. Competition shows how many other sellers offer the same or similar items. When you combine these two signals, you see if a product has high demand and if it will be hard or easy to stand out.
The idea of "share of search" matters here. It measures how often people search for your brand compared to others. If your share of search goes up, your sales and market share often go up too.
You should also look at what people want when they search. Some searches show people want to buy right now. Others just want information. Knowing the difference helps you pick products that will sell.
Identification
You can use tools like Google Trends to track search volume over time. These tools show if more people are searching for your product each month. AI Product Research platforms can also compare your search numbers to your competitors. This helps you see if your product is gaining ground or falling behind.
Look for these signs:
Rising search volume for your product or brand.
More searches with buying intent, like "buy now" or "best price."
Fewer strong competitors in the top search results.
Tip: Use AI tools to spot new keywords and search trends before they become popular. This gives you a head start in the market.
Customer Sentiment
Definition
Customer sentiment means how people feel about your product. You can find out if buyers are happy, sad, or excited. This signal helps you see what customers like and what they want to change. When you know customer sentiment, you can make better choices and improve your products.
Customer sentiment analysis lets you see what buyers think.
You can find common ideas in feedback and learn what matters most.
This helps you change your products to fit what customers want.
You can also learn if people dislike certain features or spot new trends.
Identification
You can learn about customer sentiment by reading reviews, survey answers, and social media posts. AI Product Research tools make this much easier. They scan thousands of comments and reviews very quickly. These tools use smart ways to show you the big picture.
Description | |
|---|---|
Data Collection | Collects text from reviews and social media posts. |
Sentiment Analysis | Checks if the feeling is good, bad, or neutral. |
Emotion Detection | Finds feelings like joy, anger, or sadness for deeper understanding. |
Targeted Sentiment Analysis | Looks at how people feel about certain parts of your product. |
You can use tools like InMoment AI, YouScan, and Zeda.io to track customer sentiment. These tools help you see what people love and what they want to change. You can use this information to improve your product and your marketing.
Tip: Watch for words or phrases that show up a lot in reviews. If many people mention the same thing, it is probably important.
Social Media Buzz

Definition
Social media buzz means people talk about your product online. This happens on Instagram, Facebook, TikTok, or X. When lots of people share, like, or comment about your product, it gets attention. Social media buzz often leads to more sales and helps you spot new trends early.
More than half of internet users look to social media for product ideas. Many shoppers, especially Gen Z, find new brands and products through social media and influencers. Stores with active social accounts get more sales, and most buyers check social media before buying.
Statistic | Value |
|---|---|
Expected worth of social commerce industry by 2025 | |
Increase in sales for stores with social accounts | 32% more sales |
Percentage of online buyers looking at social media before purchase | 84% |
Percentage of social media users who bought from Instagram | 22% |
Percentage of social media users who bought from Facebook | 21% |
Expected number of social buyers in the US by 2025 | 108 million |
Global social commerce sales by 2026 | $6 trillion |
Users learning about brands through social media ads | 28% |
Users making purchases after seeing ads | 48% |
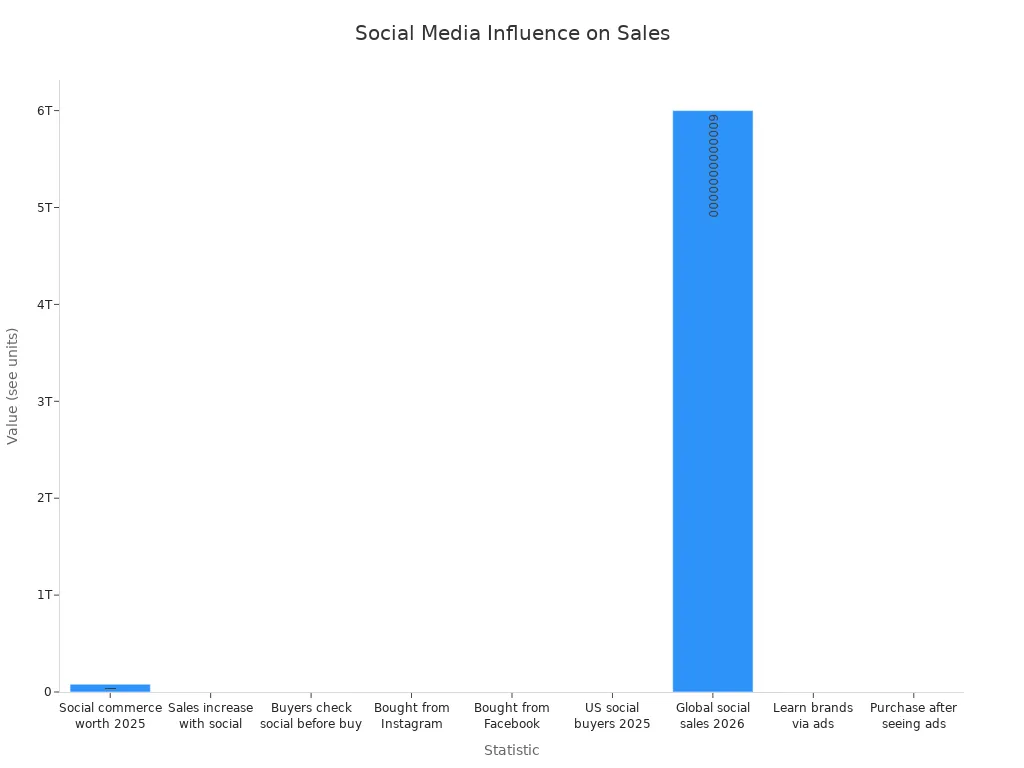
60% of Gen Z shoppers find new brands on Instagram.
86% of marketers say social media gives them more exposure.
72% of buyers trust reviews and testimonials from others.
Identification
You can spot social media buzz by tracking mentions, hashtags, and shares. AI Product Research tools like Brandwatch and YouScan help you watch millions of conversations in real time. These tools show you when people talk about your brand or product and alert you when trends spike.
Brandwatch tracks conversations on many platforms and shows what is trending.
The Iris AI engine finds new trends and checks how people feel about your brand.
AI-powered listening tools scan posts in many languages and send alerts when something big happens.
These tools help you see how people feel about your brand and let you act fast if things change.
Note: If you see a sudden jump in mentions or positive comments, your product might be about to take off.
Value Proposition
Definition
A value proposition tells customers why they should buy your product. It explains what makes your product special and how it solves their problems. A strong value proposition helps you stand out and reach the right buyers. When your value matches what customers want, you have a better chance of creating a best-seller.
A strong value proposition shows the unique benefits of your product.
It comes from knowing what your customers need and what problems they face.
When your product matches customer needs, you get a good product-market fit.
This is the main reason people choose your product over others.
The value proposition is the main reason someone buys your product.
It is key for a business that wants to last and grow.
Happy customers mean your business can keep creating value.
Identification
You can find and test your value proposition by talking to customers and checking their feedback. AI Product Research tools help you do this faster and with more detail. They look at what customers say, track how people use your product, and show you what matters most.
Tools like Insight7, HubSpot CRM, Gong.io, and Salesforce help you check your value proposition by studying feedback and tracking sales talks.
These tools help you see if your product solves real problems for your customers.
The Value Proposition Canvas is a simple way to map out what your product offers and what your customers need.
A clear value proposition helps you focus on what matters. You can improve your product, make better ads, and reach the right people.
Tip: Use feedback from customers to update your value proposition. If you see a new problem or need, change your message and product to match.
Repeat Purchase
Definition
Repeat purchase means customers come back to buy your product again and again. When people buy more than once, it shows they trust your brand and like what you offer. This signal is one of the strongest signs that your product could become a best-seller. If you see customers returning, you know you are doing something right.
You might wonder why repeat purchases matter so much. Here are some facts:
Only 20% of first-time buyers will likely make a second purchase.
Once someone buys a second time, they are much more likely to keep buying from you.
Repeat customers make up almost half of all ecommerce sales.
Stores with 40% repeat customers can earn 50% more money than stores with only 10% repeat buyers.
Let’s look at the numbers:
Statistic Description | Value |
|---|---|
Percentage of customers making a second order | |
Percentage of customers making a third order | 62% |
Percentage of customers making a fourth or fifth order | 81% |
When you focus on repeat purchases, you build a loyal customer base. Loyal customers spend more and help your business grow faster.
Identification
You can spot repeat purchase signals by tracking how often customers come back. Look for patterns in your sales data. If you see the same names or emails popping up, that’s a good sign. You can also check how much time passes between each order. Shorter gaps mean customers love your product.
AI Product Research tools make this job much easier. These tools can scan your sales records and highlight repeat buyers. Some of the best tools for this are:
Tool | Features |
|---|---|
Insight7 | Gives you numbers and insights from customer calls and messages. |
CallRail | Tracks calls and shows which marketing efforts bring back customers. |
Gong.io | Analyzes conversations to find buying signals and repeat interest. |
DialogTech | Uses voice recognition to spot loyal customers and track their feedback in real time. |
Invoca | Combines data from different channels to give a full view of customer behavior. |
Here’s how you can use these tools:
Set up alerts for when a customer places another order.
Use dashboards to see which products get the most repeat buyers.
Listen to customer calls or read messages to find out why people come back.
Check if certain products or offers lead to more repeat purchases.
Tip: Happy customers are your best marketers. When you see repeat buyers, ask them for reviews or referrals. Their feedback can help you improve your product and attract even more loyal fans.
Tracking repeat purchases helps you spot winning products early. It also shows you where to focus your marketing and customer service. With the right AI Product Research tools, you can turn one-time buyers into lifelong customers.
Applying Signals

AI Product Research Tools
You have a lot of smart tools at your fingertips. Tools like Eliotron, Maze, and ProductXpert help you spot winning products fast. Here’s how you can use them:
Pick your tool. Choose one that fits your needs. Eliotron is great for tracking sales velocity. Maze helps you see trends. ProductXpert shows you what your competitors do.
Set up your dashboard. Most tools let you see all your data in one place. You can track sales, search volume, and customer reviews.
Use alerts. Set up notifications for big changes. If sales jump or drop, you get a message right away.
Check reports often. Look at the charts and graphs. These show you if your product is getting more popular or if you need to make changes.
Tip: Try out free trials before you buy a tool. This helps you find the best fit for your business.
Manual Methods
You don’t need fancy tools to start. You can use simple steps to spot signals by hand:
Track sales in a notebook or spreadsheet. Write down how many items you sell each week.
Read customer reviews. Look for words that come up a lot. Happy words mean people like your product.
Search online. Use Google Trends to see if more people look for your product.
Watch your competitors. Visit their websites. See what they promote and how they talk about their products.
Here’s a quick checklist:
Step | What to Do |
|---|---|
Sales Tracking | Write down sales numbers weekly |
Review Reading | Note common words in reviews |
Trend Checking | Use Google Trends for keywords |
Competitor Watching | Visit and study rival websites |
Workflow Integration
You get the best results when you mix both AI tools and manual checks. Here’s a simple workflow you can follow:
Start with AI tools. Let them scan big data and spot early signals.
Double-check by hand. Read reviews and look at your own sales numbers.
Make a habit. Set a time each week to review your findings.
Write down what works. Keep notes on which signals led to good products.
Adjust your plan. If you see new trends, change your approach.
Note: Mixing AI Product Research with your own checks helps you catch things that computers might miss. Your experience and gut feeling still matter.
When you build a repeatable workflow, you save time and make better choices. You can spot best-sellers before everyone else.
Pitfalls
Data Misinterpretation
You might think your data tells a clear story, but mistakes can sneak in fast. If you use messy or incomplete data, your predictions can go off track. Sometimes, you see patterns that aren’t real because your data isn’t clean. You may also miss important trends if you don’t look at all the facts.
Here are some common mistakes people make when reading predictive signals:
You use data that has missing values or doesn’t match up from different sources.
You pick models that are too complex, so they learn noise instead of real patterns.
You forget to check if your models work well in real situations, not just in tests.
When you misread your data, you risk making poor choices. Take a look at how this can hurt your business:
Problem | Impact |
|---|---|
Discrepancies in data | |
Inaccurate analytics | Misinterpretation and poor business moves |
Unreliable data | Missed market trends and customer insights |
Tip: Always double-check your data before you trust the results. Clean data leads to better decisions.
Overreliance
AI tools make your job easier, but you shouldn’t let them do all the thinking. If you depend only on AI, you might lose touch with your own skills. You could miss important details that only a human can spot. Sometimes, AI systems copy old mistakes or have security problems.
Here’s a quick look at the risks of relying too much on AI:
Risk Category | Description |
|---|---|
Security Vulnerabilities | AI may repeat known problems from training data |
Diminished Understanding | You lose deep knowledge, making fixes harder |
Responsibility and Legal Risks | Unclear who is at fault if AI causes issues |
Regulatory Compliance | Changing rules can make it tough to follow laws |
Maintenance Challenges | Hard to keep systems running if key people leave |
Note: Use AI as a helper, not a boss. Your own judgment is still important.
Market Context
You need to look beyond the numbers. The market changes all the time, and signals can shift quickly. News, trends, and customer moods can change what works and what doesn’t. If you ignore the bigger picture, you might miss out on new opportunities or get caught by surprise.
Here are some ways market context shapes your results:
News feeds gather stories from many sources, showing how people feel about products.
Watching trends and sentiment shifts helps you see what’s coming next.
AI lets you move from just describing what happened to predicting what will happen.
You can turn raw data into smart ideas that help you make better choices.
Tip: Stay curious. Check the news, watch your competitors, and listen to your customers. Adapt your plan when the market changes.
If you keep these pitfalls in mind, you’ll make smarter decisions and avoid common traps. Mix AI insights with your own experience, and always pay attention to what’s happening around you.
You can use seven signals to help find top products with AI Product Research. These signals let you see trends, learn what customers want, and make your sales plan better. Here is how companies use these signals:
Signal Type | Example Use | Impact on Sales |
|---|---|---|
Feature requests | Find needs that are not met | Help change products |
Bug reports | Show people use your product | Make customers happier |
Help desk inquiries | See if users are active | Find ways to sell more |
VIP activity | Notice when leaders are interested | Get bigger deals |
Tech stack changes | Watch for new technology | Reach new buyers |
Company milestones | Use new launches | Match your marketing |
Website activity | Check if people visit your site | Get more sales |
Try these ideas and tell us what you think or ask questions below. Your thoughts help everyone learn together!
FAQ
What is AI product research?
AI product research uses smart computer tools to help you find products people want. You get facts and trends fast. You make better choices and save time.
How do I know which AI tool is best for me?
You should look at your business needs. Try free trials. Check if the tool tracks sales, trends, and customer reviews. Pick one that feels easy to use.
Can I use AI product research if I am new to selling online?
Yes! Many AI tools have simple dashboards. You can start with basic features. You learn as you go. You do not need to be an expert.
What signal should I watch first?
Start with sales velocity. It shows how fast your product sells. If you see quick sales, you may have a winner. You can check other signals next.
Do I need to use all seven signals?
You do not have to use every signal at once. Begin with two or three. Add more as you get comfortable. Each signal gives you a new clue.
How often should I check my product signals?
Check your signals every week. You spot changes early. You can adjust your plan fast. Regular checks help you stay ahead.
Can AI replace my own product research?
No, AI helps you work smarter. You still need your own ideas and experience. Mix AI insights with your own checks for the best results.
TangBuy: A Smarter Way to Dropship in 2025
If you're looking to stay competitive with dropshipping in 2025, speed and trend-awareness are key. TangBuy helps you stay ahead with real-time product trends, fast fulfilment, and factory-direct sourcing. With over 1 million ready-to-ship items, 24-hour order processing, and seamless Shopify integration, TangBuy makes it easier to test, scale, and succeed in today's fast-moving eCommerce landscape.
See Also
5 Innovative Methods to Find Popular Items for Your Store
Uncovering the Truth About eBay's Best-Selling Vintage Items
Current Hot Items to Maximize Your Profits This Year
2025 BigBuy Dropshipping Analysis: Genuine User Feedback and Reviews